You can run this notebook in a live session ![]() or view it on Github
or view it on Github .
Introduction to SpectroChemPy
The SpectroChemPy project was developed to provide advanced tools for processing and analyzing spectroscopic data, initially for internal purposes in the LCS (https://www.lcs.ensicaen.fr).
SpectroChemPy is essentially a library written in python language and which proposes objects (NDDataset, and Project) to contain data, equipped with methods to analyze, transform or display this data in a simple way by the user.
The processed data are mainly spectroscopic data from techniques such as IR, Raman or NMR, but they are not limited to this type of application, as any type of numerical data arranged in tabular form can generally serve as the main input.
To follow actively this tutorial, there are several possibilities.
If you have a python distribution installed on your computer, you can download the notebooks archives or you can clone the Github repository
.
You can use the pages associated with this tutorial on Bnder
 .
.Or you can also use Google Colaboratory.
SpectroChemPy installation
In principle when running in a classic jupyter notebook or in jupyter lab, SpectroChemPy is already installed. If it is not the case, you must install it and its package dependencies using in the terminal:
python -m pip install spectrochempy
or
conda install -c spectrocat spectrochempy
More detail on the installation for different OS can be found in the documentation
Loading the SpectroChemPy API
The recommended way of loading SpectroChemPy in the notebook namespace is as follow:
[1]:
import spectrochempy as scp

|
SpectroChemPy's API - v.0.4.5.dev22 © Copyright 2014-2022 - A.Travert & C.Fernandez @ LCS |
Importing experimental data
Let’s show a first example. In the following cell we read experimental data aquired on an IR spectrometer in the OMNIC (spg) format and stored in our example repository on GitHub: spectrochempy_data/testdata.
We simply specified the relative path with respect to the testdata folder, i.e., "irdata/nh4y-activation.spg".
[2]:
X = scp.read("irdata/nh4y-activation.spg")
nh4y-activation.spg has been downloaded and written in /home/runner/.spectrochempy/testdata/irdata
It is worth to note that the data are downloaded from the remote repository and stored locall in the datadir default directory. As it is stored locally, if for some reason we need to download it again, it will be faster as no connection with the remote server need to be established again.
To check that everything has been executed normally, you can print the X NDDataset informations.
[3]:
X
[3]:
| name | nh4y-activation |
| author | runner@fv-az213-499 |
| created | 2022-03-25 22:07:27.245262+00:00 |
| description | Omnic title: NH4Y-activation.SPG Omnic filename: /home/runner/.spectrochempy/testdata/irdata/nh4y-activation.spg |
| history | 2022-03-25 22:07:27.245262+00:00:imported from spg file /home/runner/.spectrochempy/testdata/irdata/nh4y-activation.spg ; 2022-03-25 22:07:27.245262+00:00:sorted by date |
| DATA | |
| title | absorbance |
| values | [[ 2.057 2.061 ... 2.013 2.012] [ 2.033 2.037 ... 1.913 1.911] ... [ 1.794 1.791 ... 1.198 1.198] [ 1.816 1.815 ... 1.24 1.238]] a.u. |
| shape | (y:55, x:5549) |
| DIMENSION `x` | |
| size | 5549 |
| title | wavenumbers |
| coordinates | [ 6000 5999 ... 650.9 649.9] cm⁻¹ |
| DIMENSION `y` | |
| size | 55 |
| title | acquisition timestamp (GMT) |
| coordinates | [1.468e+09 1.468e+09 ... 1.468e+09 1.468e+09] s |
| labels | [[ 2016-07-06 19:03:14+00:00 2016-07-06 19:13:14+00:00 ... 2016-07-07 04:03:17+00:00 2016-07-07 04:13:17+00:00] [ vz0466.spa, Wed Jul 06 21:00:38 2016 (GMT+02:00) vz0467.spa, Wed Jul 06 21:10:38 2016 (GMT+02:00) ... vz0520.spa, Thu Jul 07 06:00:41 2016 (GMT+02:00) vz0521.spa, Thu Jul 07 06:10:41 2016 (GMT+02:00)]] |
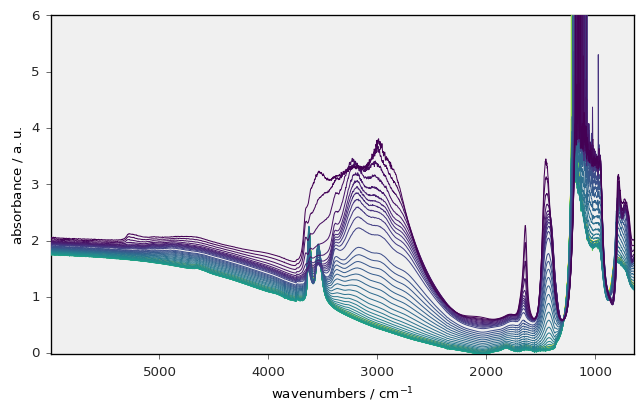
or plot it:
[4]:
_ = X.plot()
[ ]: